2 years after
Context & PhD recap
Maybe this is your first time here. Let me quickly introduce myself and my research topic (you can see the research page for more details). I work in the Technology-Enhanced Learning field. More precisely, I work mainly on AI & Learning Analytics (Gašević et al., 2015), defined as:
The collection, analysis, interpretation and communication of data about learners and their learning that provides theoretically relevant and actionable insights to enhance learning and teaching.
As I described on the main page:
I develop dashboards powered by AI and learning analytics to help teachers support students’ out-of-class activities in K-12 education. Interested in Human-AI Interaction and responsible AI integration in education.
I love my subject. I love the multidisciplinarity of my work (it mixes many fields) and the different activities it needs: design, development, communication, talking with users (students and teachers) and asking the right questions.
I started the PhD 2 years ago. Some days, it feels like 2 months. Other days, it feels like 10 years (but that's not the subject of today's article). In this article, I'll explain how my PhD works: the method, the steps and what comes out of them.
A great start
Before I started, research was a mystery to me. Nobody in my family or among my friends worked in research. I only knew it from the outside, and I imagined a place full of curiosity, debates and smart people who love to learn.
During the first months, we usually focus on a very specific task: 📘reading the state of the art (the existing work on my topic). Every week, I discovered a new idea, a new word or a new thing to deepen.
At the end of this phase, we published an article on the Responsible Integration of AI in Education (Saurel et al., 2025).
The method: Design-Based Research
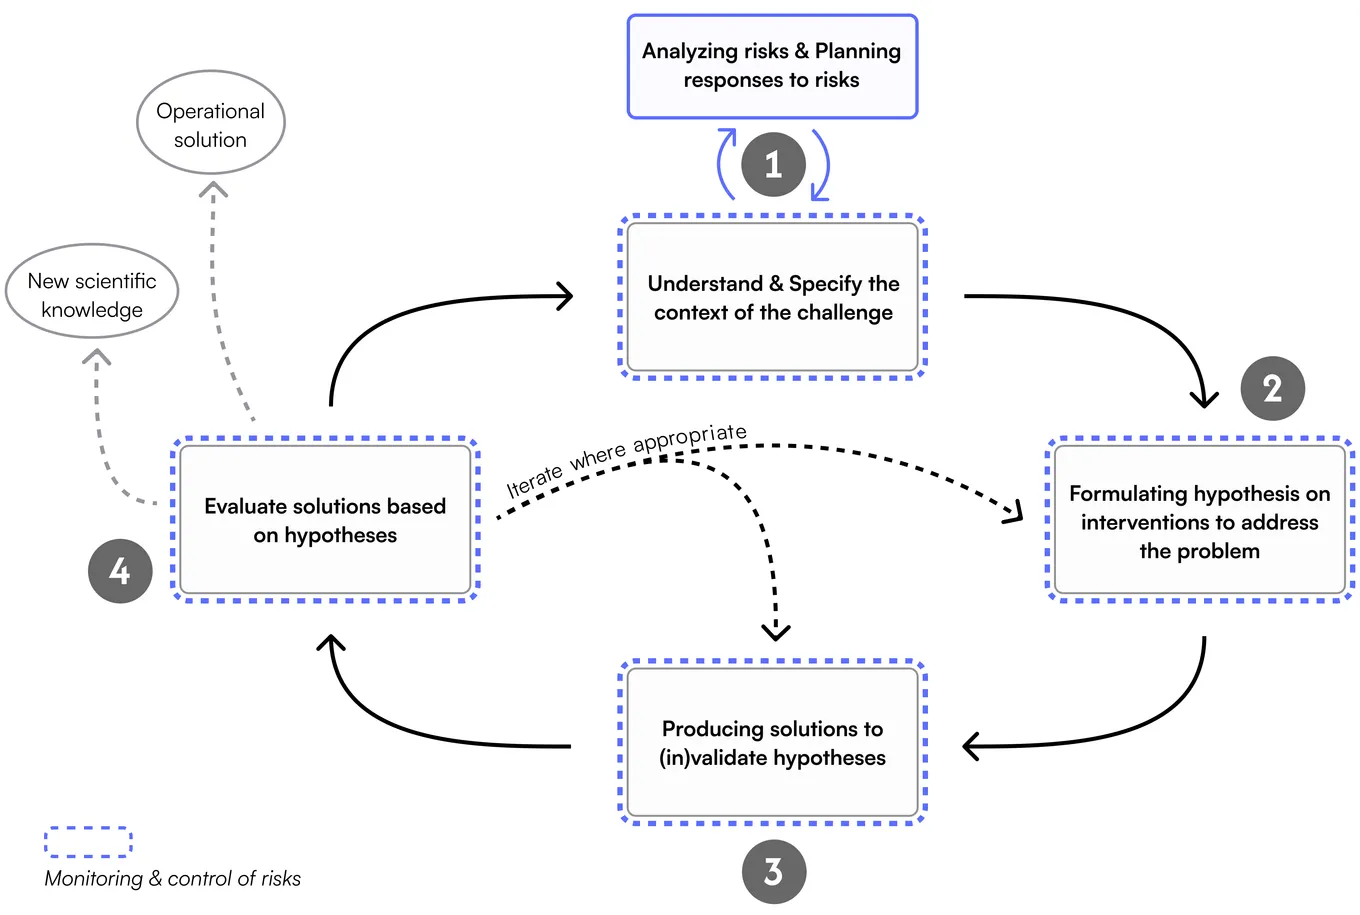
Our project follows Design-Based Research (DBR) (Anderson & Shattuck, 2012). In DBR, we design a tool, we test it in a real context, and we use the results to improve both the tool and the theory behind it. We repeat this multiple times. Each cycle teaches us something about the tool and something about learning.
In our case, the real context is a classroom. The tool is an app for students and a dashboard for teachers. The users are teachers and students aged 13 to 14.
We also use mixed methods to do our research: this means that we use qualitative methods and quantitative methods together. Qualitative methods collect words and opinions, for example in interviews. Quantitative methods collect numbers, for example the traces that students leave when they use an application. We use both in different ways:
- QUAL ➡️ QUAN;
- QUAN ➡️ QUAL;
- QUAL + QUAN;
- etc.
In our first paper, we also proposed an enriched version of DBR that adds risk management to the cycle. You can see it in the figure below. I talk about it in the EIAH post.
The loop
1. Understand & Specify context
We start each cycle with the users. A focus group is a group discussion with a few users about a precise topic. We run focus groups with teachers (and students) to understand their pedagogical needs and to specify the context of use. At this step, we also show early prototypes to get feedback.
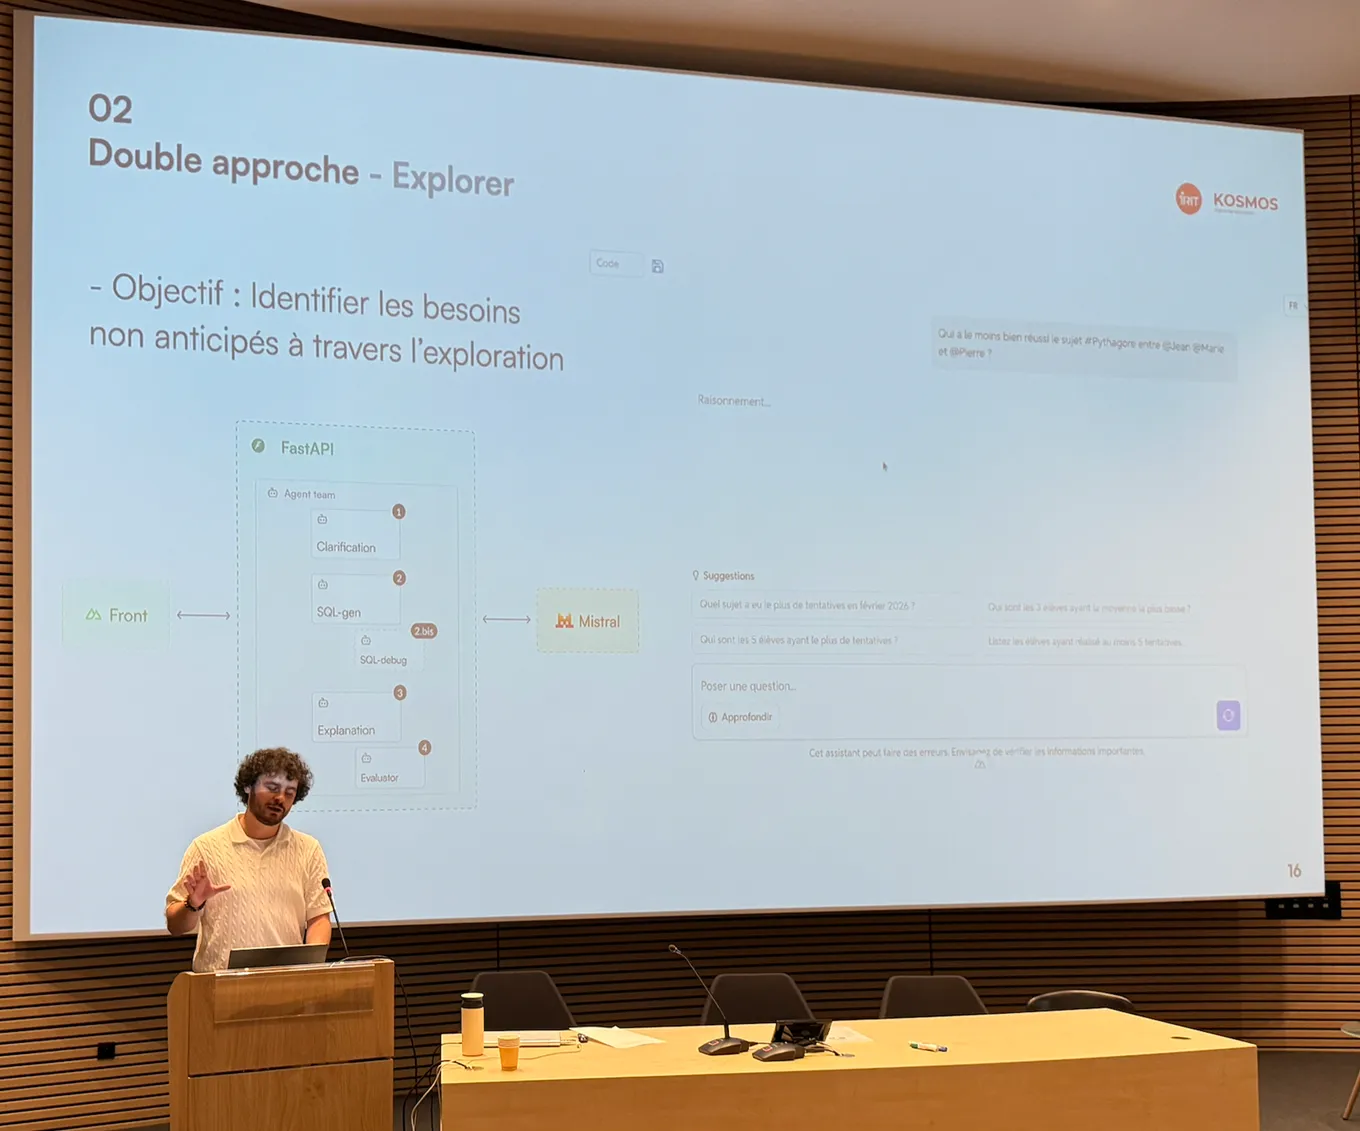
Focus groups give us the "why". They tell us what is useful, what is confusing and what nobody asked for. We also published our work on a novel double approach, combining a top-down validation (annotating mockups) and a bottom-up exploration (with a chatbot) (Saurel et al., 2026).
2. Formulate hypotheses & Develop the application
Once we know the context, we use it and the scientific literature to formulate hypotheses.
Then we build. The tool is an app for students and a dashboard for teachers. This is one of the steps I like the most. A working prototype is a research instrument: it lets us test an idea with real people, not only describe it.
3. Experiments
Then we test the tool in real classes. For the first experiment, around 400 students and 9 teachers took part. Before an experiment, we code a lot, and I feel a lot of pressure to provide the best tool for users, but also to have something reliable for research. During the experiment, the application collects several interaction traces (answering questions, consulting answers, etc.). After the experiment, we analyze these traces. We also come back to teachers and students with new focus groups to hear how they used the tool, what they liked and disliked, etc.
What comes out of the loop
Each turn of the loop gives several kinds of results: qualitative, quantitative, but also "operational solutions", i.e. software.
It was not planned at the start, but the loop produced tools that other people can use. Two examples are MAESTRO and MAESTRO-bench.
MAESTRO is a Multi-Agent Educational System for Tutoring and Recommendation Orchestration. It uses teams of specialized AI agents to handle different use cases, for example to select indicators, to explain a visualization or to give recommendations to teachers. We presented it as a demo at ECTEL 2025, and it was 🏆 nominated for Best Demo (Saurel et al., 2025).
MAESTRO-bench is the benchmark that goes with it. A benchmark is a set of tests that measures how well a system works. It lets us compare different configurations of the system in a fair way. We presented it as a poster at LAK 2026, under the title "Mind the Gap" (Saurel et al., 2026).
What I like about this loop
Each step feeds the next one. A focus group gives an idea, the idea becomes code, the code goes into an experiment, and the experiment creates new questions. We do not work alone on a theory for years. We get feedback often, from real users, and this is so stimulating.
This is also why this work is multidisciplinary. In one month, we can write code, prepare a discussion with teachers, read a paper on some theory and analyze data.
References
- Anderson, T., & Shattuck, J. (2012). Design-Based Research: A Decade of Progress in Education Research?. Educational Researcher, 41(1), 16-25. https://doi.org/10.3102/0013189X11428813
- Gašević, D., Dawson, S., & Siemens, G. (2015). Let's not forget: Learning analytics are about learning. https://doi.org/10.1007/s11528-014-0822-x
- Saurel, R., Silvestre, F., Raclet, J.-B., & Lescure, E. (2025). Intégration responsable de l'IA Générative dans l'Éducation : proposition d'un plan d'actions stratégiques dirigé par les risques liés aux questions éthiques. EIAH 2025. https://hal.science/hal-05070808
- Saurel, R., Silvestre, F., Raclet, J.-B., & Lescure, E. (2025). MAESTRO: Multi-Agent Educational System for Tutoring and Recommendation Orchestration. https://hal.science/hal-05141354
- Saurel, R., Félix, E., Silvestre, F., Raclet, J.-B., & Lescure, E. (2026). Une double approche pour la co-conception de tableaux de bord d'apprentissage : validation avec des prototypes, exploration avec un chatbot. RJC EIAH 2026. https://hal.science/hal-05641999
- Saurel, R., Silvestre, F., Raclet, J.-B., & Lescure, E. (2026). Mind the Gap: Benchmarking AI vs. Human in Automatic Short Answer Grading. https://hal.science/hal-05481914
- SoLAR (2026). SoLAR. http://solaresearch.org/